Tutorial - Interval overlap
This tutorial demonstrates the usage of gat with a simple example - do the binding sites of a transcription factor overlap with DNAse hypersensitive sites?
This tutorial uses the SRF data set described in Valouev et al. (2008). The data sets used in this tutorial are available at:
http://www.cgat.org/~andreas/documentation/gat-examples/TutorialIntervalOverlap.tar.gz
The data is in srf.hg19.bed. This bed formatted file
contains 556 high confidence peaks from the analysis of Valouev et al. (2008)
mapped to human chromosome hg19.
This tutorial concentrates on obtaining the data required for a GAT analysis.
First analysis
gat requires three sets of intervals:
- a set of segments delineating the active part of the genome (workspace), and
- a set of segments of interest (tracks), and
- a set of segments with annotations.
gat accepts bed formatted files as input.
As segments of interest we will be using the srf.hgf19.bed
containing the results of the ChIP-Seq experiment:
chr5    60627981        60628031        SRF.1
chr5    137801055       137801105       SRF.2
chr5    137800766       137800816       SRF.3
chr7    5570273 5570323 SRF.4
chr5    137827838       137827888       SRF.5
...
As our workspace we will for now use the bed formatted
contigs.bed, which simply lists all chromosomes in hg19:
chr13   0       115169878       ws
chr12   0       133851895       ws
chr11   0       135006516       ws
chr10   0       135534747       ws
chr17   0       81195210        ws
...
The question we ask is whether within the genome, SRF binding events are in regions of open chromatin as identified by DNAse I hypersensitive sites.
There are many sources for bed files. Not having the data ourselves, we make use of data deposited by the ENCODE project within the UCSC genome browser.
To find the relevant data, we start by searching for the term
Jurkat with track search. We find the page with a list of ENCODE datasets:
http://genome.ucsc.edu/cgi-bin/hgTrackUi?g=wgEncodeUwDnase&hgsid=337398699
Selecting Jurkat, we can then open the table browser and
download bed formatted coordinates directly:
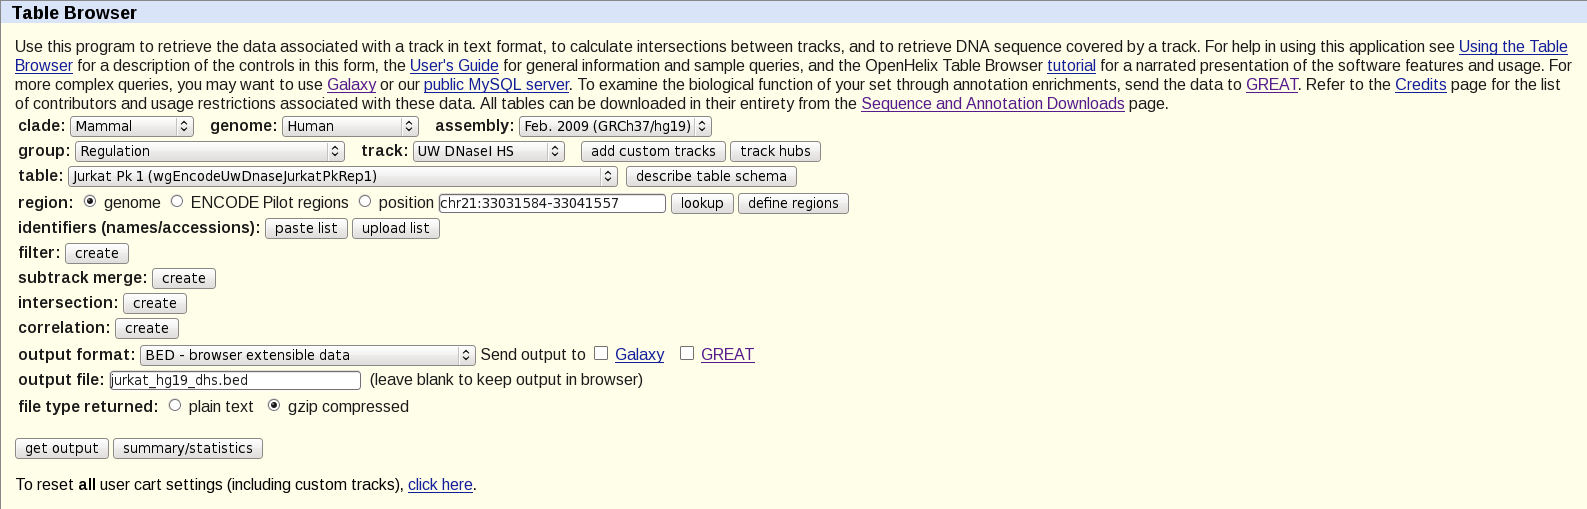
Alternative ways to obtain and manipulate bed-files are galaxy and bedtools.
We can now run gat by giving specifying the three input files:
gat-run.py
   --segments=srf.hg19.bed.gz
   --annotations=jurkat.hg19.dhs.bed.gz
   --workspace=contigs.bed.gz
   --ignore-segment-tracks
   --num-samples=1000 --log=gat.log > gat.tsv
The option –ignore-segment-tracks tells gat to ignore the fourth column in the tracks file and assume that all intervals in this file belong to the same track. If not given, each interval would be treated separately.
The above statement finishes in a few seconds. With large interval collections or many annotations, gat might take a while. It is thus good practice to always save the output in a file. The option –log tells gat to save information or warning messages into a separate log file.
The first 10 columns of the output file are the most informative:
| track | annotation | observed | expected | CI95low | CI95high | stddev | fold | l2fold | pvalue |
| merged | tb_wgEncodeUwDnaseJurkatPkRep1 | 20183 | 246.5650 | 96.0000 | 444.0000 | 105.5933 | 81.5301 | 6.3493 | 1.0000e-03 |
The table states that we observe an overlap of 20,183 nucleotides, but would expect an overlap of 247 nucleotides, which is an 82 fold enrichment. This is highly significant (p-value of 0.001).
Note that the number of simulations determines the minimum P-value that can be reported. Here, we did 1,000 simulations, thus the minimum P-value we can obtain is 0.001. Usually a few simulations (100) are required to get a good idea about enrichment. For publication, more simulations are required (>10,000) to get a good idea of the statistical significance.
More samples increases memory and runtime requirements of GAT. The computation above took 11 seconds on our local system. Increasing the number of simulations to 10.000 increases the runtime to 103 seconds. Note how the runtime increases linearly with the number of samples.
Do the results make sense? Instead of the Jurkat cells, we can test for enrichment with DHS sites in hepatocytes.
We obtain a bed-file as before from UCSC and ENCODE (cell line
hepg2) and save it as hepg2.hg19.dhs.bed.gz. Next, we run GAT
with this file instead:
gat-run.py --segments=srf.hg19.bed.gz
           --annotations=hepg2.hg19.dhs.bed.gz
           --workspace=contigs.bed.gz
           --ignore-segment-tracks
           --num-samples=1000
           --log=gat-hepg-unique.tsv.log
GAT reports:
| track | annotation | observed | expected | CI95low | CI95high | stddev | fold | l2fold | pvalue |
| merged | tb_wgEncodeUwDnaseHepg2HotspotsRep1 | 18965 | 597.1380 | 339.0000 | 883.0000 | 166.9945 | 31.7084 | 4.9868 | 1.0000e-03 |
Note how the fold enrichment is now less (32 fold), though still highly significant. This is the expected result, DHS sensitive sites are shared among different tissue types.
We can test this by comparing the two different DHS sets against each other:
gat-run.py --segments=hepg2.hg19.dhs.bed.gz
           --annotations=jurkat.hg19.dhs.bed.gz
           --workspace=contigs.bed.gz --ignore-segment-tracks --num-samples=1000 > dhs.tsv
| track | annotation | observed | expected | CI95low | CI95high | stddev | fold | l2fold | pvalue | qvalue |
| merged | tb_wgEncodeUwDnaseJurkatPkRep1 | 6163503 | 456928.2770 | 443565.0000 | 470129.0000 | 8119.7800 | 13.4890 | 3.7537 | 1.0000e-03 | 1.0000e-03 |
Indeed, the overlap between DHS sites is significant (pvalue = 0.001). We observe a 6.2Mb overlap, but expect only a 0.5Mb overlap. This is a 13-fold enrichment.
The runtime has increased from 11s to 308s. Apart from the number of samples, the number of segments in the segments of interest are a major determinant of the time it takes to complete a run. More information about memory and time requirement of GAT are in the section about GAT Performance.
Let us try removing all intervals from hepg2.hg19.dhs.bed.gz that overlap sites found in
Jurkat cells using bedtools:
intersectBed -a hepg2.hg19.dhs.bed.gz -b jurkat.hg19.dhs.bed.gz -wa -v | gzip > hepg2_unique.dhs.bed.gz
106,308 segments out of 144,172 remain.
Next, we re-run the GAT analysis:
gat-run.py --segments=srf.hg19.bed.gz --annotations=hepg2-unique.hg19.dhs.bed.gz --workspace=contigs.bed.gz  \
           --ignore-segment-tracks      \
            --num-samples=1000 --log=gat-hepg-unique.tsv.log
| track | annotation | observed | expected | CI95low | CI95high | stddev | fold | l2fold | pvalue | qvalue |
| merged | . | 425 | 324.6790 | 143.0000 | 539.0000 | 117.8233 | 1.3080 | 0.3874 | 1.8500e-01 | 1.8500e-01 |
Now, we observe only a 30% enrichment and this is not significant (P-value 0.19). The observed overlap of 425 nucleotides is very close to the expected 325 nucleotides. We conclude, that the overlap of SRF between DHS sites in hepatocytes is due to those DHS sites that are shared between hepatocytes and Jurkat cells.
This example showed how GAT can be used in a very simple scenario to test if two genomic features are associated with each other. The following tutorials will introduce more complex usage, for example using the effective genome and testing multiple annotations simultaneously.