Introduction
A common question in genomic analysis is whether two sets of genomic intervals overlap significantly. This question arises, for example, in the interpretation of ChIP-Seq or RNA-Seq data.
The Genomic Association Tester (GAT) is a tool for computing the significance of overlap between multiple sets of genomic intervals. GAT estimates significance based on simulation.
This introduction covers the Method basics and describes the Sampling method. It introduces the concept of the Effective Genome and explains how to account for G+C bias
Method basics
Gat implemements a sampling algorithm. Given a chromosome (workspace) and segments of interest, for example from a ChIP-Seq experiment, gat creates randomized version of the segments of interest falling into the workspace. These sampled segments are then compared to existing genomic annotations.
The example below introduces the three sets of genomic intervals. The workspace, in this case a single chromosome, is grey. The segments of interest and sampled segments derived from it are red and light red, (workspace) and segments of interest, respectively. In this analysis, the annotations are the location of introns (green) and promotors (blue) and we use gat to test if the intervals in the ChIP-Seq experiment are enriched in promotors and/or introns.
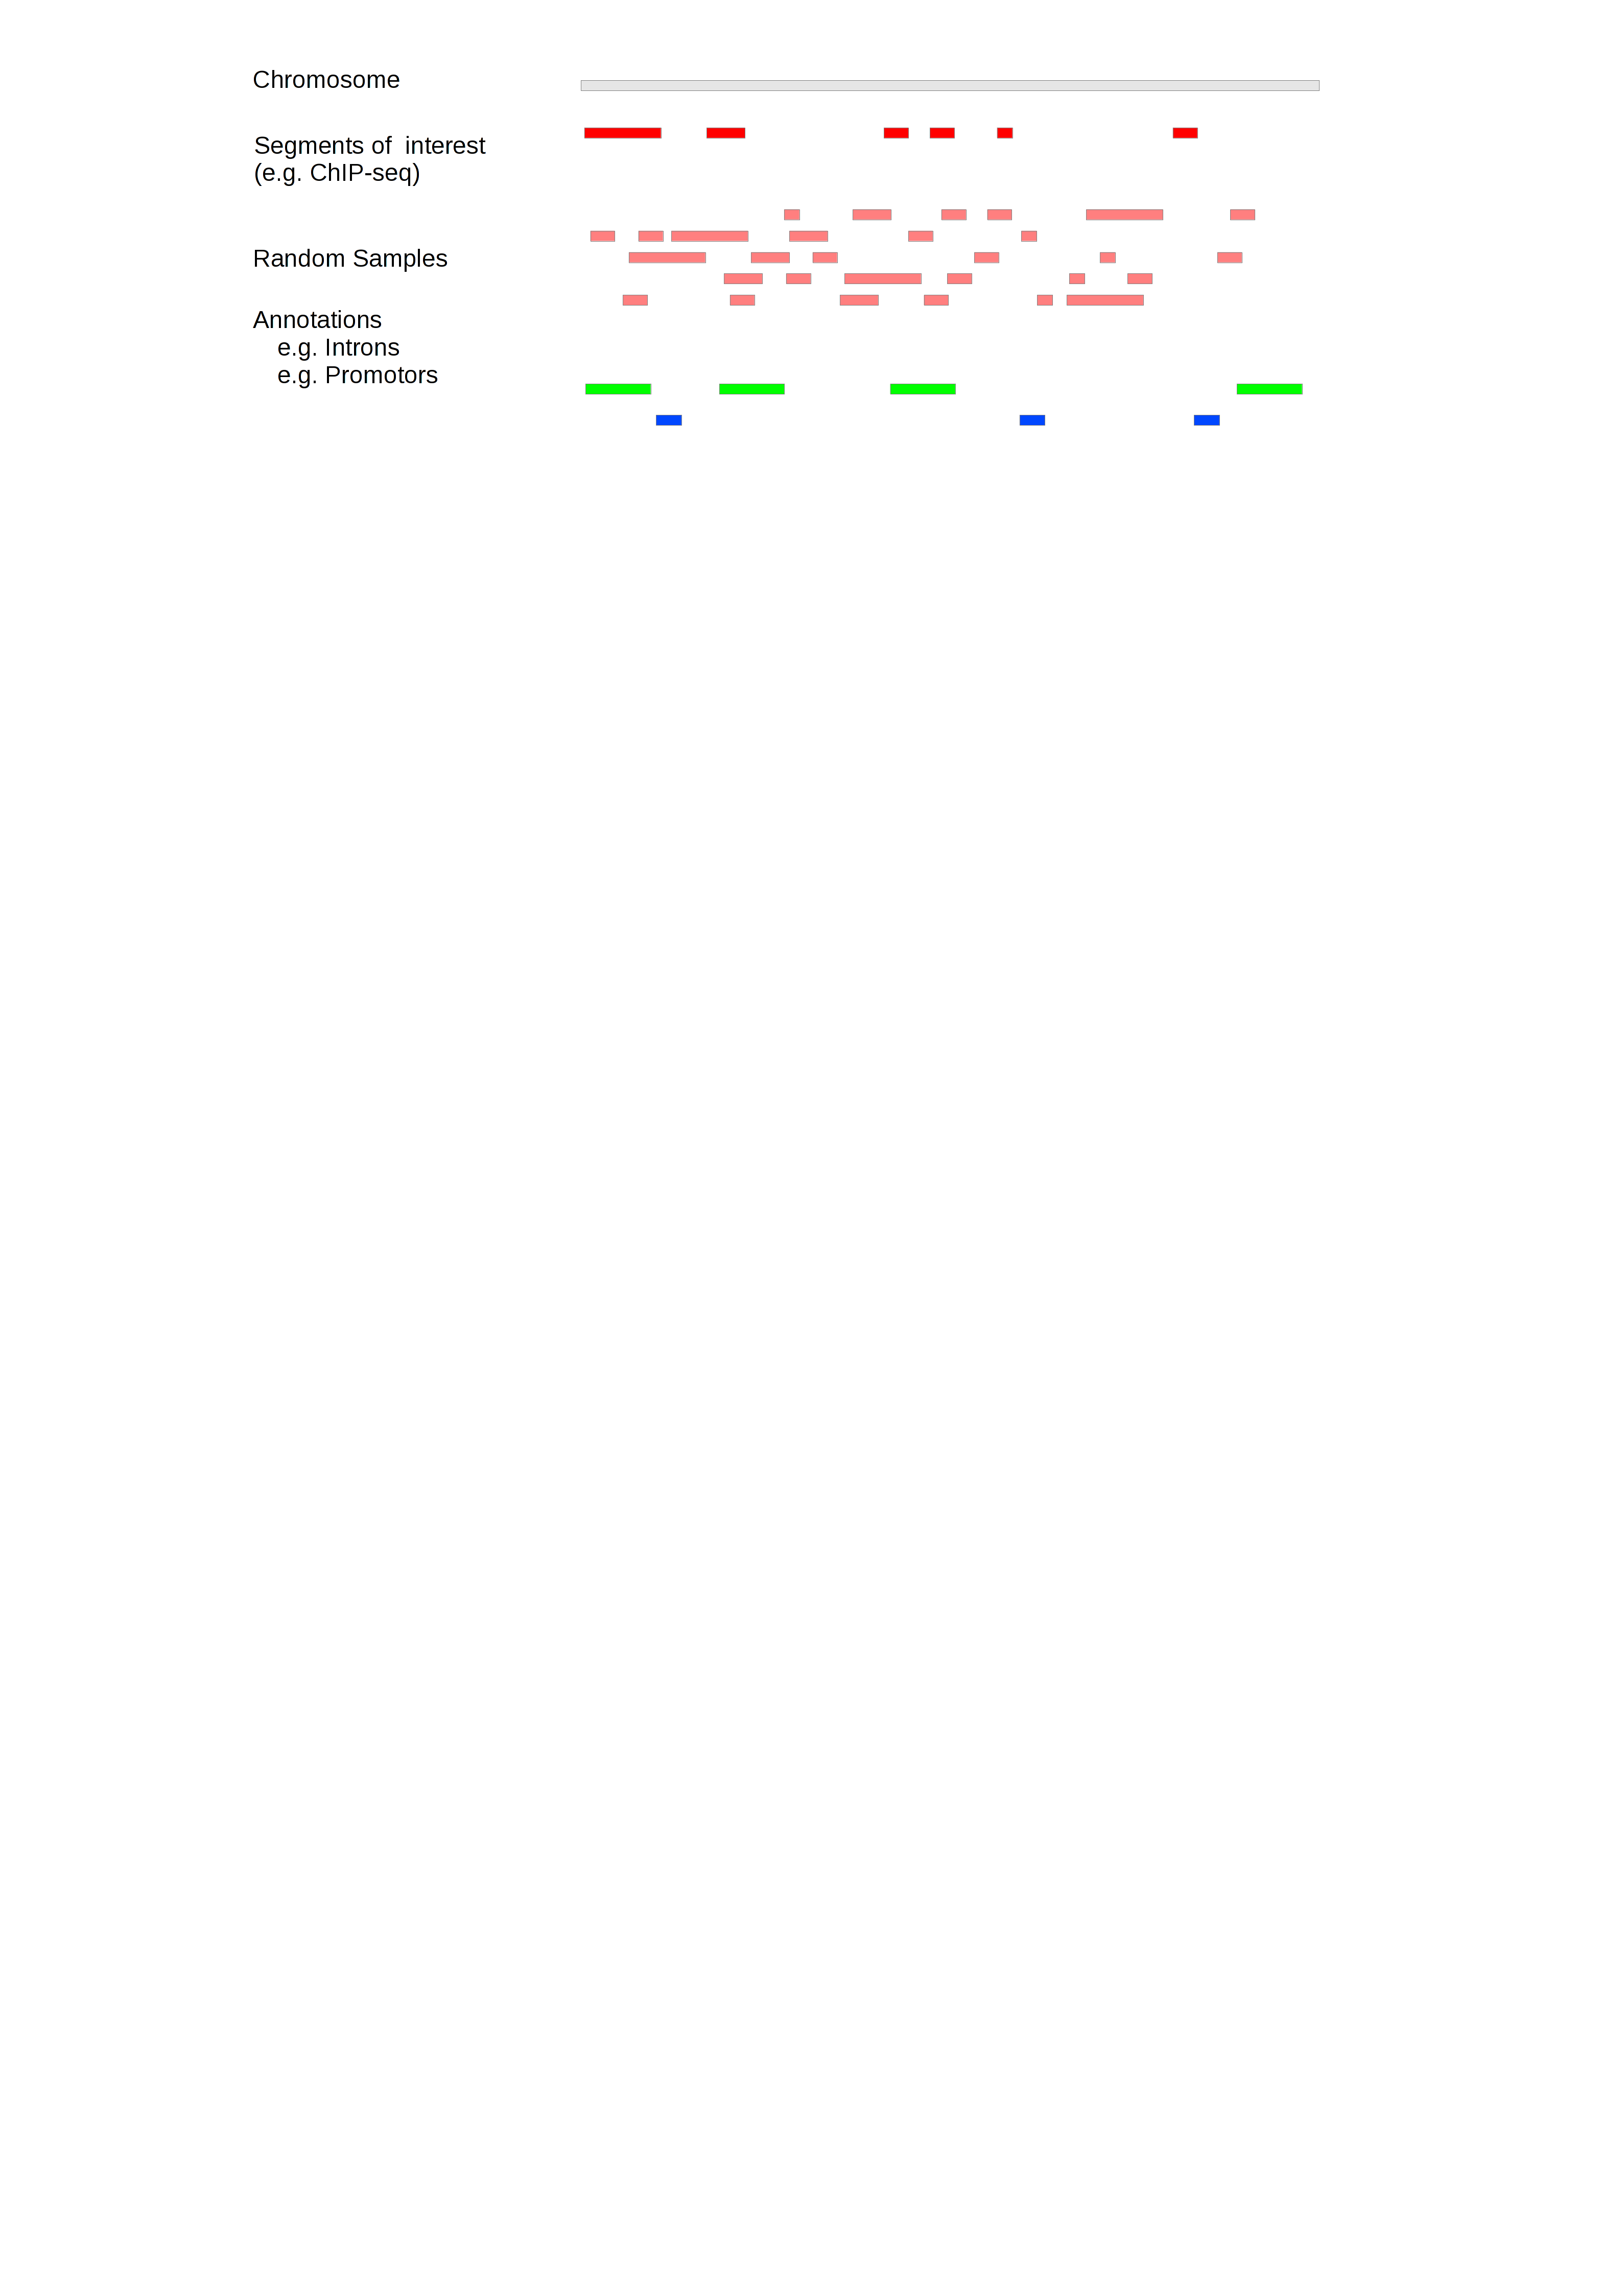
In the example above, five sets of sampled segments have been created. Usually, the number of samples would be much larger (>1000).
Based on the sampled segments, the observed overlap is contrasted with the expected overlap and an empirical p-value is determined. The sampled segments provide an expectation of the overlap between the segments of interest with a particular annotation. The distribution of the overlap is computed and the empirical p-value is defined as the number of samples that show an equal or greater overlap than the observed overlap.
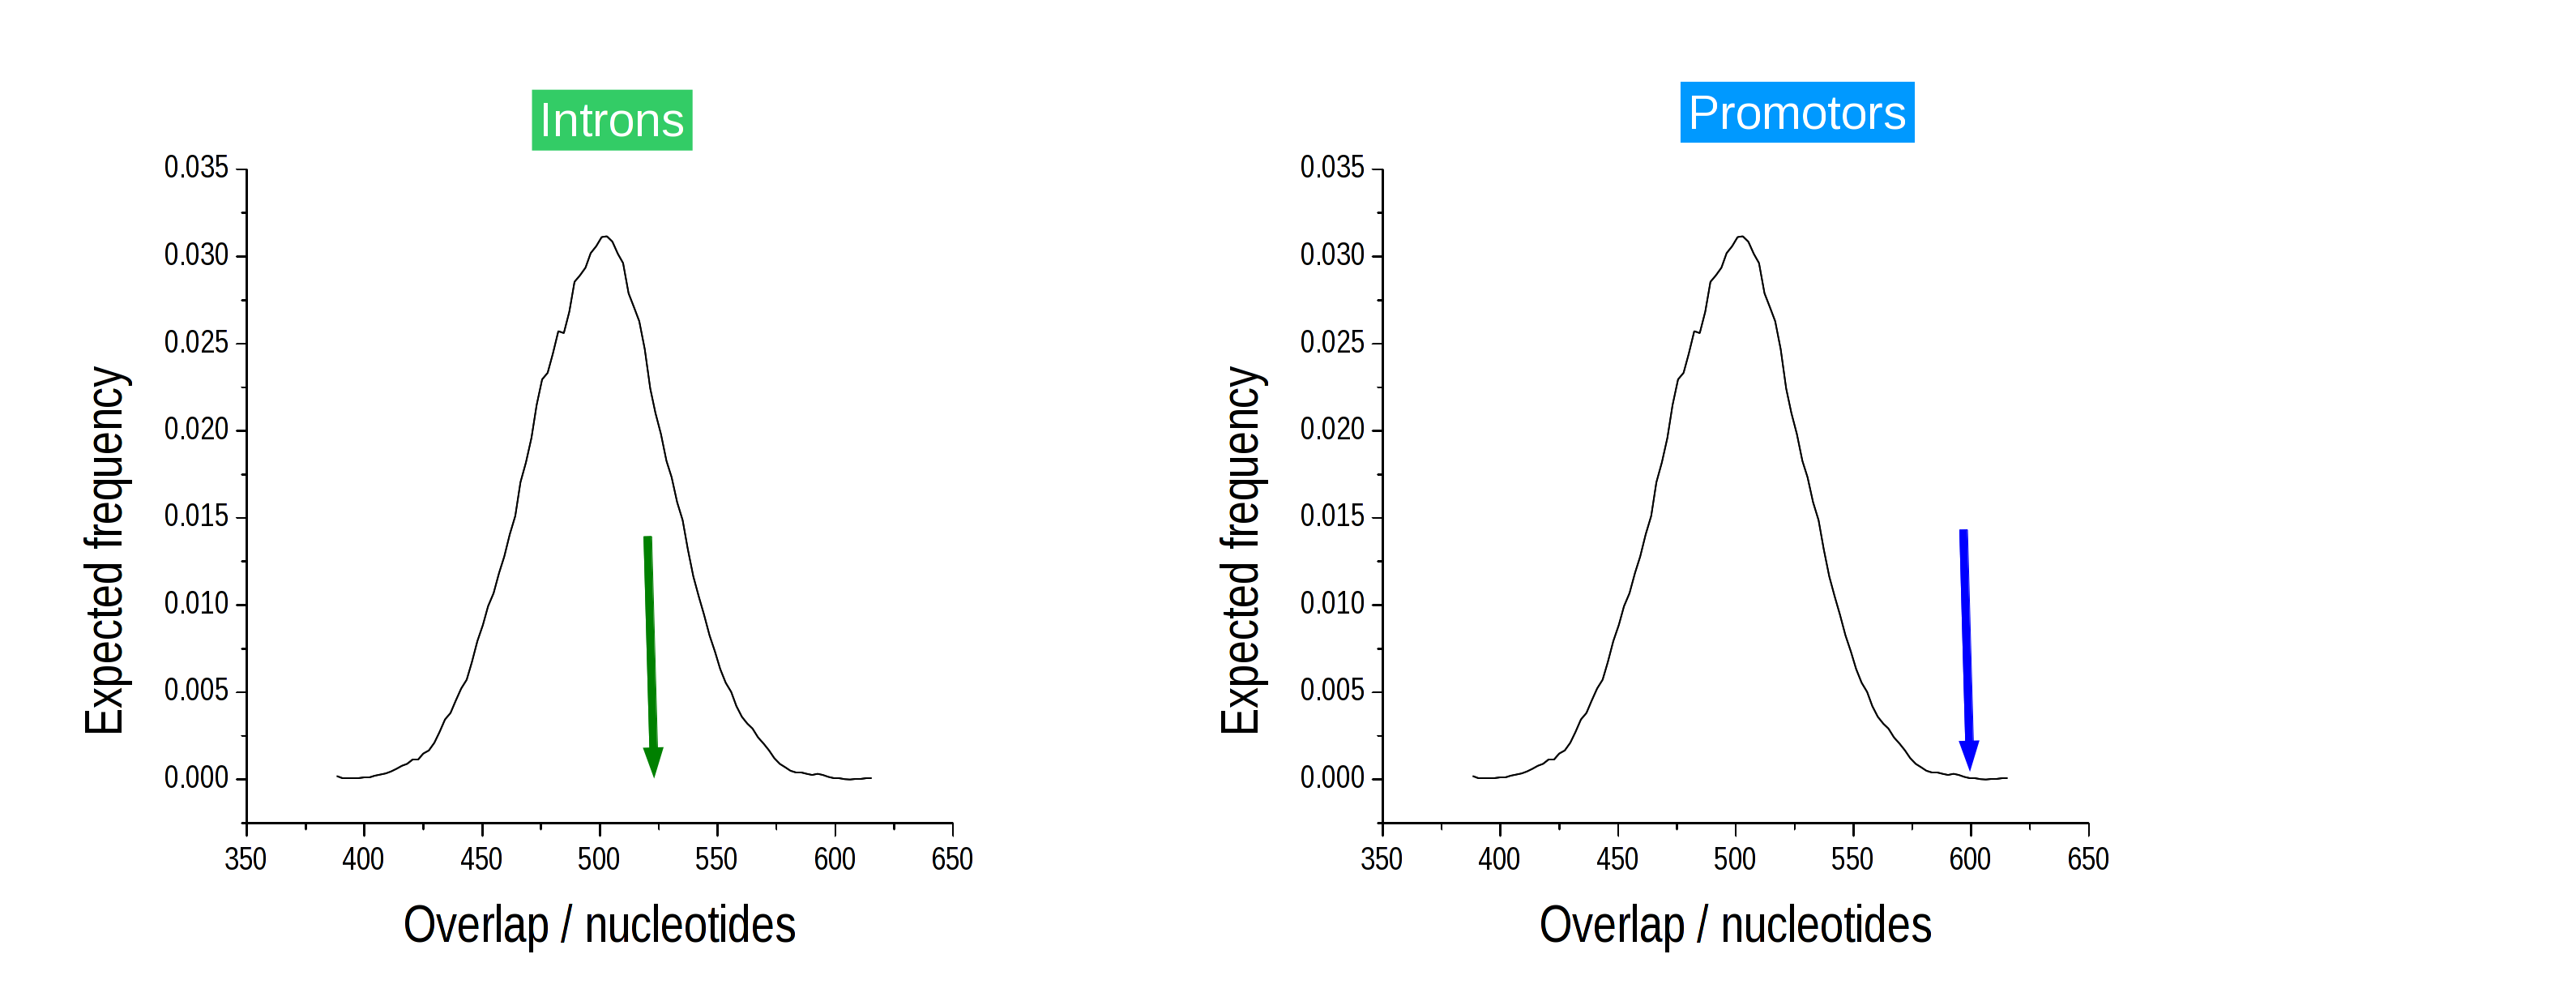
In the previous example, the overlap with promotors is significant (right), while the overlap with introns (left) is not significantly different from the expectation. We would thus conclude, that our ChIP-Seq intervals are significantly enriched in promotors, but not enriched in introns. Testing for depletion works similarly.
Sampling method
The sampling method is conceptually simple. Randomized samples of the segments of interest are created in a two-step procedure.
Firstly, a segment size is selected from to same size distribution as the original segments of interest. Secondly, a random position is assigned to the segment. The sampling stops when exactly the same number of nucleotides have been sampled.
To improve the speed of sampling, segment overlap is not resolved until the very end of the sampling procedure. Conflicts are then resolved by randomly removing and re-sampling segments until a covering set has been achieved.
Because the size of randomized segments is derived from the observed segment size distribution of the segments of interest, the actual segment sizes in the sampled segments are usually not exactly identical to the ones in the segments of interest. This is in contrast to a sampling method that permutes segment positions within the workspace.
Effective genome
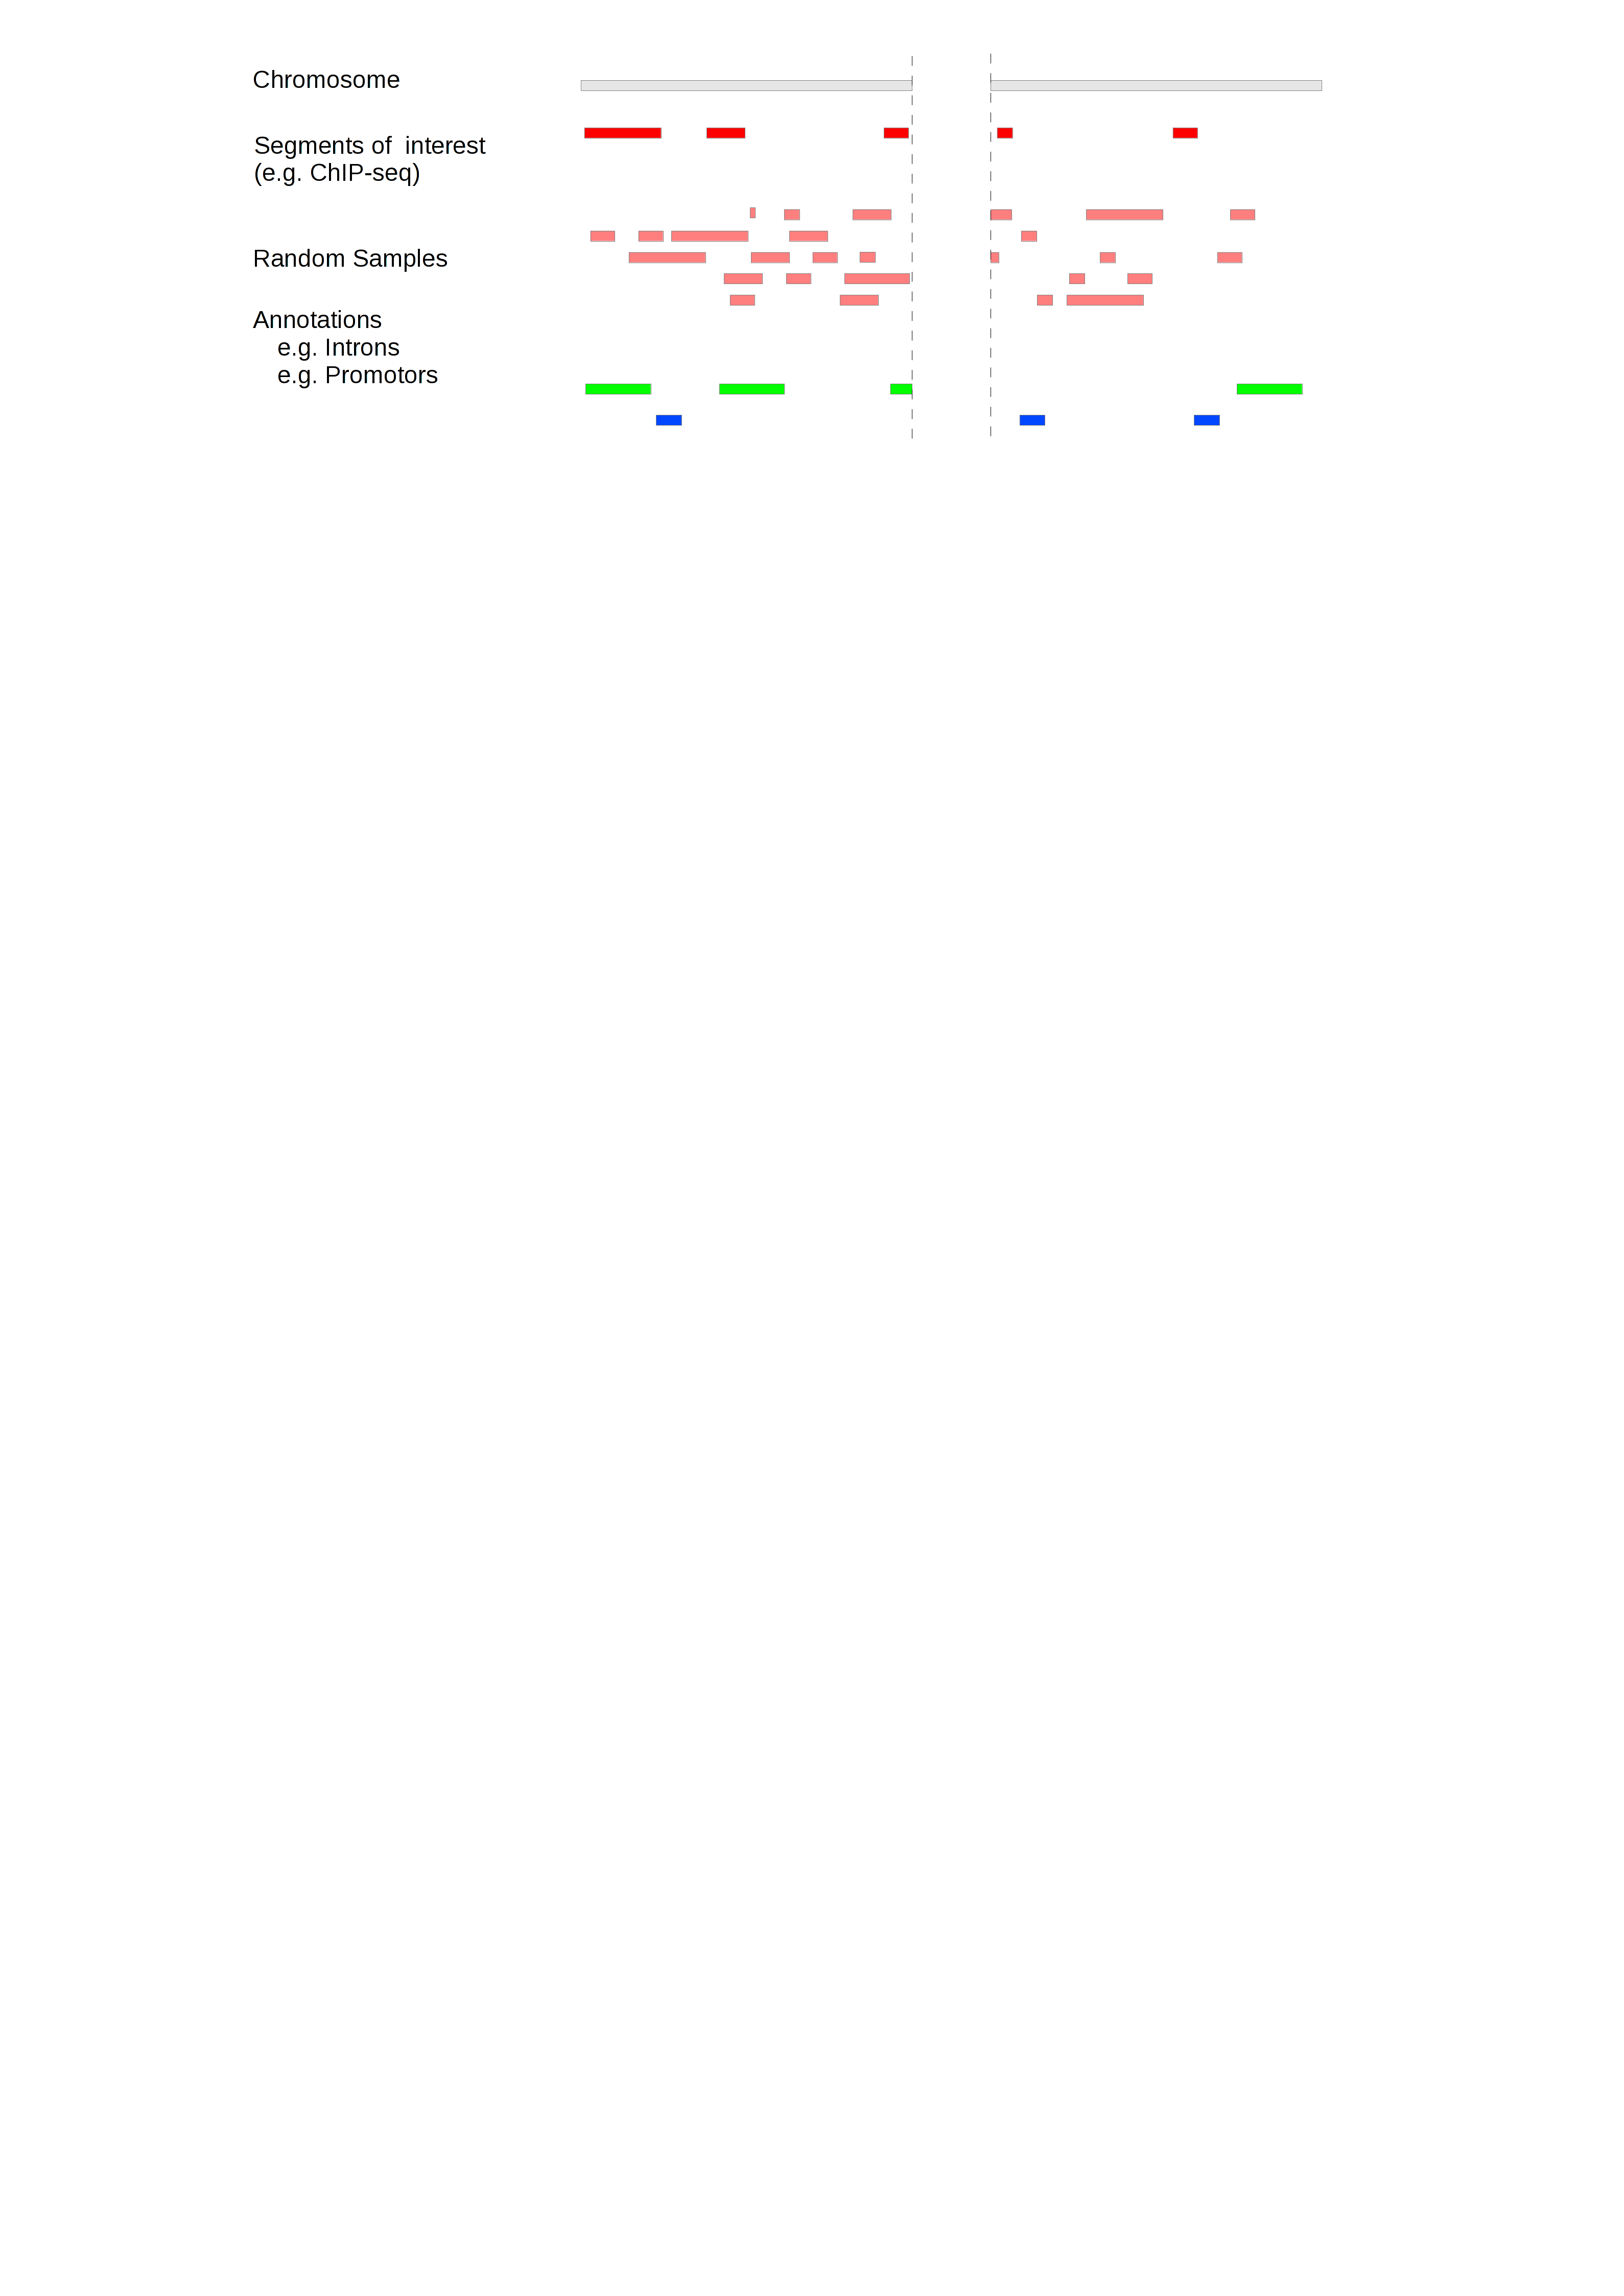
Not all regions of the genome are equally accessible to the segments of interest. For example, reads from a ChIP-Seq experiment will never be mapped to a region that is an assembly gap. Failing to account for inaccessible regions causes inflated estimates of fold change and statistical significance.
To illustrate this, assume that a particular set of segments of interest can only be present on chrX. If we included all chromosomes in the workspace, any overlap between the segments of interest and any annotations on chrX would be overestimated as the sampled segments are spread over both chrX and the autosomes.
Such a chromosomal bias is strong and obvious. Often the bias is much more distributed. For example, when comparing orthologous positions between two genomes in a comparative analysis, it is important that the workspace is restricted to only those regions where there is genomic alignment, as orthologous positions will not be found outside of regions that can be aligned.
In order to account for the effective genome, GAT limits the accessible space for simulated segments to a workspace, which can be restricted to exclude all regions not appropriate for the analysis. Randomly sampled segments will not fall outside the workspace:
What regions need to be excluded from the analysis depends very much on the test being performed. Commonly excluded are for example assembly gaps and regions of low mapability for NGS experiments.
The definition of a workspace is crucial and often several workspace restrictions need to be combined. For example, in order to test if human long non-coding RNA that are shared with mouse overlap with certain chromatin marks, the workspace should be restricted to only those genomic regions in human that align in mouse and also be limited to regions of high mapability.
G+C bias
The human genome (together with many others) is not uniform. Best known is its division into regions of low and high G+C content (isochores). Other genomic properties correlate with these, such as gene density, substitution rates, etc. Plus, next-generation sequencing methods display their own G+C biases.
GAT can control for these biases by splitting the genomic region accessible for simulated segments (workspace) into smaller regions (isochores). Segments are sampled on a per-isochore basis, thus preserving any confounding effects due to different G+C content, before the overall enrichment is computed by combining results from all isochores.
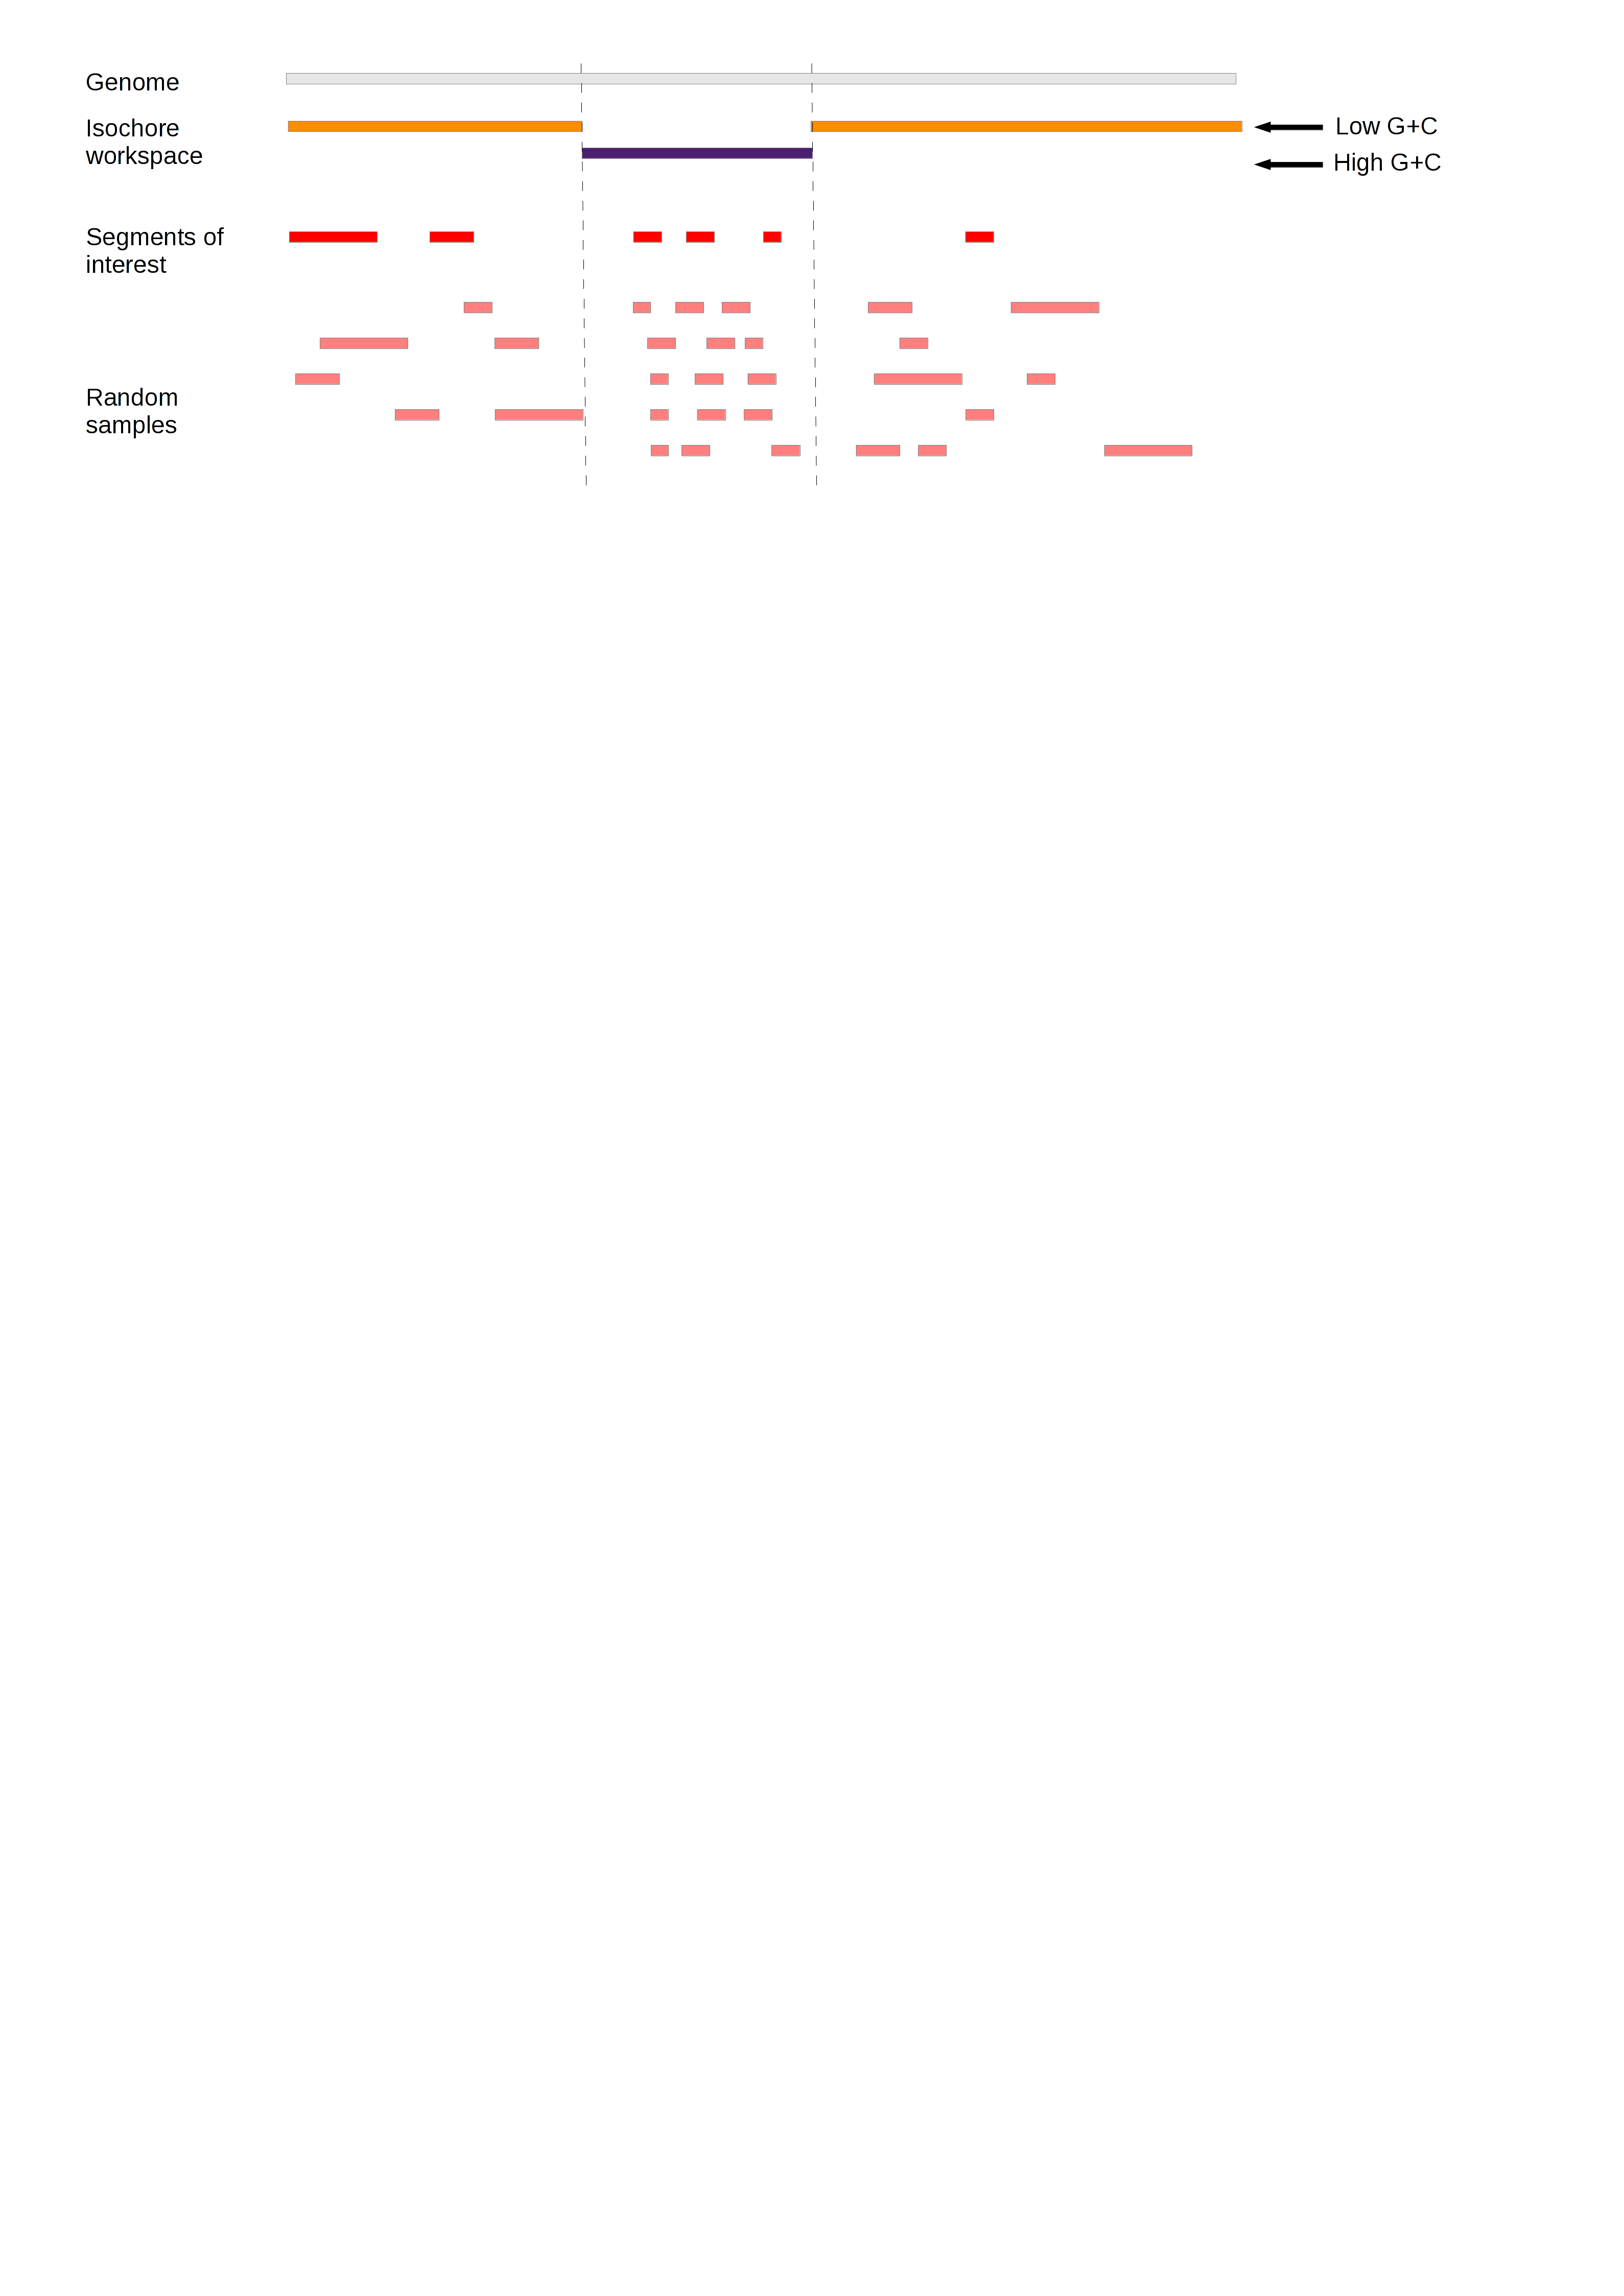
In the example above, G+C content correlates with the density of segments of interest. Regions of low G+C (orange) contain fewer segments than regions of high G+C (purple). Sampling within separate isochores preserves the difference in density.
The workspace can be divided into an arbitrary amount of different isochores. This is a general technique that can be used to control for different types of bias.